
The latest reported payment and transfer scam statistics from the FTC, FBI IC3, UK Finance and Australia’s National Anti-Scam Centre — with sources — and what they mean for anyone who buys, sells or gets paid online.
Payment and transfer fraud is now one of the largest categories of consumer crime in the English-speaking world. This page pulls together the most recent reported figures from the official sources — the US Federal Trade Commission (FTC), the FBI’s Internet Crime Complaint Center (IC3), UK Finance and Australia’s National Anti-Scam Centre — and explains what they mean if you buy, sell, or get paid online. Every figure below is attributed and linked; these are the agencies’ numbers, not ours.
Original research: the denominations fake-payment fraud actually targets
A Square Solutions original analysis · data window 28 June – 25 July 2026 · published 24 July 2026
Download the data: Denomination distribution, Jun-Jul 2026 (CSV). Free to reuse and re-analyse with attribution to A Square Solutions.
Most fraud reporting measures losses. Losses are reported after the fact, and small frauds are almost never reported at all — which means the public picture of fake-payment fraud is biased toward large, memorable cases. We looked at the problem from the other end: search demand.
Across our own Search Console corpus for this site — 103,000 search impressions in a 28-day window — we isolated every query that named an explicit money amount alongside payment, transfer or screenshot terms (60 distinct queries, 604 impressions; year tokens excluded).
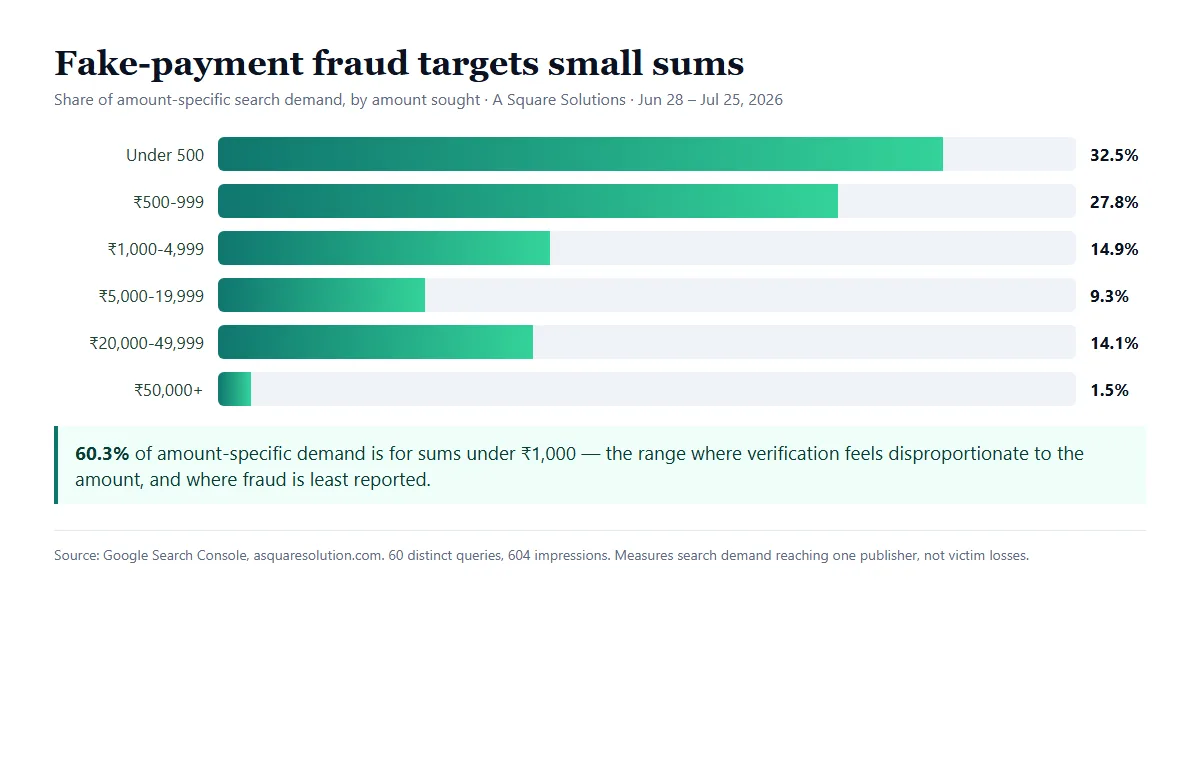
Finding: 6 in 10 amount-specific searches are for sums under ₹1,000
| Amount sought | Share of amount-specific search impressions |
|---|---|
| Under ₹500 | 32.5% |
| ₹500 – ₹999 | 27.8% |
| ₹1,000 – ₹4,999 | 14.9% |
| ₹5,000 – ₹19,999 | 9.3% |
| ₹20,000 – ₹49,999 | 14.1% |
| ₹50,000+ | 1.5% |
60.3% of all amount-specific demand sits below ₹1,000, with a single most-searched figure of ₹500. A distinct secondary peak appears at ₹20,000–₹50,000 (14.1%) — consistent with higher-value marketplace and electronics transactions rather than everyday counter payments.
Why the small-sum concentration matters
Sub-₹1,000 is the range where verification friction exceeds perceived risk. A shopkeeper handing over goods worth ₹400 rarely opens a banking app to confirm a credit; a seller shipping a ₹30,000 phone usually does. Fraud concentrates precisely where checking feels disproportionate to the amount — which is also the range least likely to be reported to police or a bank, and therefore least likely to appear in official loss statistics.
The practical implication is uncomfortable but simple: the verification habit has to apply to small payments, not just large ones. The threshold at which people start checking is roughly the threshold at which fraud stops.
Methodology and limitations
Data source: Google Search Console impressions for asquaresolution.com, 28 June – 25 July 2026. Queries were included where a numeric value between 20 and 200,000 appeared alongside payment/transfer/screenshot terminology; calendar-year tokens were excluded. Percentages are shares of impressions, not of victims.
Stated limitations: this measures search demand reaching a single publisher, not total market demand, and it does not distinguish intent — the corpus mixes victims attempting to verify a payment with actors seeking to produce forgeries. We publish it as a demand-side signal about which denominations the fake-payment economy is organised around, not as a victim-loss estimate. We do not publish, link to, or describe forgery methods.
Researchers and journalists may cite this analysis with attribution to A Square Solutions. For the underlying methodology or a comment, use our contact page.
Key numbers at a glance
- US: Consumers reported losing $12.5 billion to fraud in 2024 — a 25% jump on the prior year (FTC). Reported losses rose again in 2025, with imposter scams alone reaching $3.5 billion, the #1 fraud category (FTC).
- US: The FBI’s IC3 logged a record $16.6 billion in internet-crime losses in 2024, up 33% year on year (FBI IC3).
- UK: Over £1.1 billion was stolen through fraud in 2024, including £450.7 million in authorised push payment (bank-transfer) fraud (UK Finance).
- UK: Purchase scams — paying for goods or services that never arrive — are the most common type of bank-transfer fraud, and 70% of these cases start online (UK Finance).
- Australia: Combined reported scam losses were $2.03 billion in 2024, with payment redirection among the top loss-making scam types (ACCC / National Anti-Scam Centre).
Worried a payment or screenshot you received is fake?
ScamCheck’s free screenshot detector reads a payment screenshot with AI and flags the signs of an edited or fake “payment” image in seconds — no sign-up, and the image isn’t stored.
United States
Federal Trade Commission (FTC)
In its most recent full-year data, the FTC reported that consumers lost $12.5 billion to fraud in 2024 — a 25% increase over 2023. Imposter scams remained the most-reported fraud category, and in 2025 reported losses to imposter scams reached $3.5 billion. The FTC also notes that, by amount lost, bank transfers and cryptocurrency are the payment methods people lose the most money through — both are fast and effectively irreversible once sent.
FBI Internet Crime Complaint Center (IC3)
The FBI’s IC3 recorded a record $16.6 billion in reported losses across all internet crime in 2024, a 33% rise on 2023. Cryptocurrency-related fraud accounted for more than $9.3 billion of that (up 66%), and business email compromise (BEC) — where criminals redirect a legitimate payment — for roughly $2.8 billion.
United Kingdom
UK Finance
UK Finance reported that more than £1.1 billion was stolen through fraud in 2024. Authorised push payment (APP) fraud — where a victim is tricked into sending a bank transfer themselves — accounted for £450.7 million. Crucially for anyone buying or selling online, purchase scams (paying in advance for goods that never arrive) are the single most common type of APP fraud, and 70% of APP fraud cases began online. Since October 2024, UK banks operate under mandatory reimbursement rules for many APP scam victims — but prevention still beats trying to claw money back.
Australia
ACCC / National Anti-Scam Centre
Australia’s National Anti-Scam Centre reported combined scam losses of $2.03 billion in 2024 — down about 26% on 2023, which the ACCC attributes partly to better detection and coordination. Payment redirection scams remained among the top scam types by loss, alongside investment and phishing.
What the data means if you buy, sell or get paid online
Three themes run through every one of these reports:
- The money moves through payments you authorise yourself. Bank transfers, APP payments and payment apps dominate the losses because, once you send, the money is usually gone. A “payment sent” screenshot from a buyer is not proof anything reached you.
- Buying and selling is a front line. Purchase scams are the most common bank-transfer fraud in the UK, and payment redirection is a top loss type in Australia. If you sell on a marketplace, a forged payment confirmation is the exact tactic being used against you.
- It starts online. 70% of UK APP fraud begins online — in a message, a listing, or a DM — which is where a quick verification habit pays off most.
The practical defence is boringly effective: confirm money has actually arrived in your own account before you ship, refund, or release anything, and treat any screenshot, email or “confirmation” as a claim to be checked, not proof. Our full guide covers exactly how to do that: how to spot and verify a fake payment screenshot. For specific platforms, see the guides for Venmo, Cash App, Zelle and PayPal.
Sources
Figures are as reported by each agency for the period stated. Where a full 2025 report was not yet published, the most recent full-year data (2024) is used.
- Federal Trade Commission — Consumer Sentinel / fraud data (2024 and 2025 releases): ftc.gov
- FBI Internet Crime Complaint Center — 2024 Internet Crime Report: ic3.gov
- UK Finance — Annual Fraud Report 2025 (2024 data): ukfinance.org.uk
- ACCC / National Anti-Scam Centre — Targeting Scams 2024: scamwatch.gov.au
This page aggregates publicly reported figures for education. A Square Solutions is not affiliated with the FTC, FBI, UK Finance or the ACCC. Always check the source for the latest numbers.
Selling to someone you don’t know? Verifying the payment is half the check — verify the business too. See whether a business is independently verified with TrustSeal.